The full economic effect of the COVID-19 pandemic is still unknown at this point. However, economists predict varying degrees of economic downturn. To compound the issue, oil producing regions are contending with the price of oil bottoming out at the same time. Although there are a lot of unknowns when it comes to the future of the U.S. economy and oil prices, we can look back at economic slowdowns in the recent past to see how markers, such as the cost of infrastructure, are affected.
AE2S Nexus considered the unique economic development experienced in the Bakken region of western North Dakota over the past 10 years to provide a benchmark of what it costs communities in the area to build infrastructure. The region experienced significant economic growth from 2010 to 2015 resulting from the rapid expansion of oil extraction from the Bakken formation. When oil prices dropped from nearly $100 a barrel to $30 in early 2016, every community in the area suffered an economic downturn. This volatility and reliance on the energy sector creates unusual economic conditions. Below we will discuss how this region’s construction costs fluctuate in comparison to the regional average and contrast that growth to the region’s oil production.
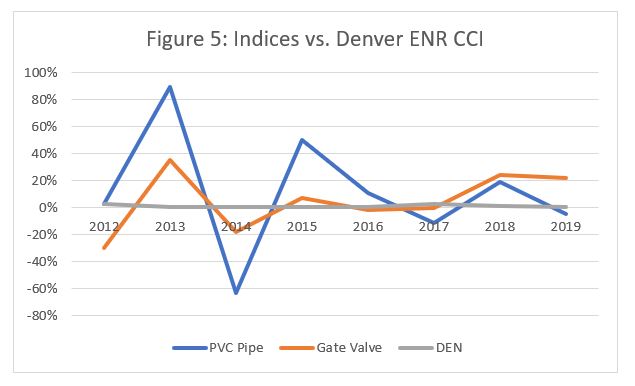
The Engineering News-Record (ENR) publishes a Construction Cost Index that is used throughout the engineering and construction industries to estimate future project costs. In addition to a nationwide index, ENR produces cost indices for 20 of the largest cities in the U.S. For this discussion, the Denver index was selected to represent the regional average. To assess the annual and long-term cost indexing for the region, a total of 177 contractor bids dated from 2010 to 2019 were reviewed. Standard 8-inch PVC pipe and 8-inch gate valves were used to identify a sampling of impacts.
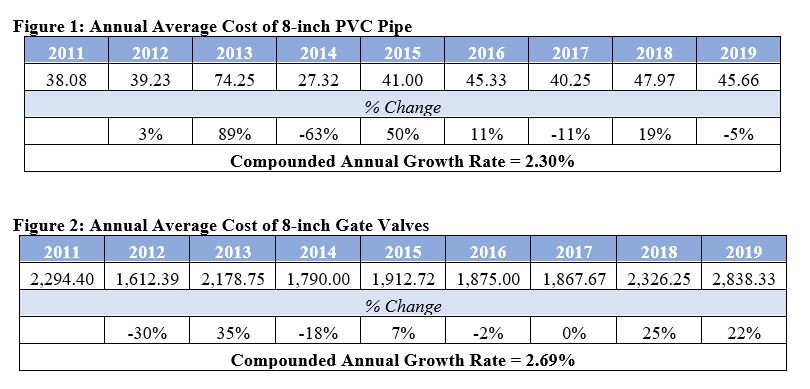
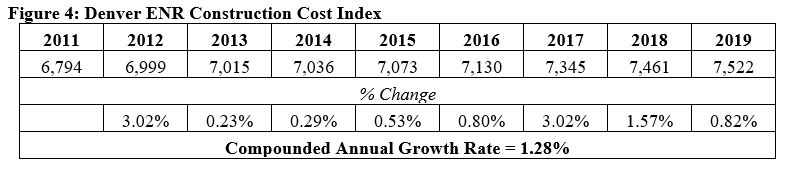
When reviewing the annual average rates of change, there is a noticeable pattern in relation to the Bakken’s rig counts over the same period. Annual price changes of the two indices (Bakken Indices) matched and often reacted significantly to changes in rig count. As shown in Figure 3, both indices increased significantly following the rising rig count in 2012 and 2013. As the number of rigs decreased in 2015 and 2016 following the drop in oil prices, a similar correction in prices is noted in the indices. As rig counts recovered from the 2016 bust, both indices have steadily increased at varying rates.
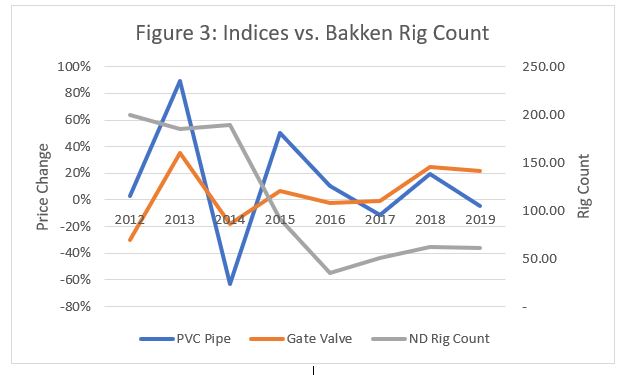
When comparing the Bakken Indices to the Denver Construction Cost Index (CCI), it is also evident that costs are impacted by the significant economic development present in the region over the last decade. Annual percent change remained relatively steady for the Denver CCI, while the Bakken Indices fluctuated significantly in response to market conditions. This sensitivity resulted in compounded annual growth rates (CAGR) nearly double the CAGR of the Denver CCI.
Although the data provided is specific to the slowdown of economic activity in the Bakken oil region of western North Dakota, it is important to be aware of the relationship between infrastructure costs and the health of the economy. Depending on the demands of building activity, communities across the country may see similar effects.
If you have questions about estimating infrastructure costs for your community’s upcoming projects, contact Abby Ritz, AE2S Nexus Financial Analyst.