Thank you to all of the water systems and utilities that participated in the 2018 Annual Utility Rate Survey! The responses are being compiled, and the complimentary booklets will be delivered later this summer. In the meantime, here is a summary of the 2018 responses related to inclining block rates in water conservation pricing.
Future water supply planning is a standard responsibility of water system managers. Changing water supply needs can be driven by a variety of factors including poor water quality, increasing demand associated with growth, and depletion of existing supplies due to climate-induced conditions such as increased evapotranspiration and reduced precipitation. This is not news to many systems that have been and continue to plan for future water source requirements and experience quantity and quality-related water resource challenges. Some parts of the country – Utah, for instance – face significant immediate drought concerns. As a result, it is not surprising that 78 percent of Utah respondents to the 2018 rate survey reported an inclining block water rate structure. Although not the only effective methodology to incentivize conservation, the inclining block rate approach to water pricing is a commonly-used tool in overall water demand management.
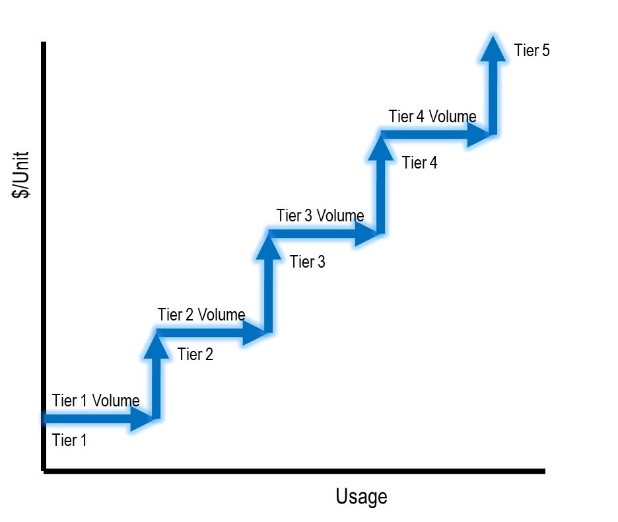
The 2018 AE2S Annual Rate Survey results indicate that overall, 44 percent of 249 municipal respondents currently utilize an inclining block rate structure. An inclining or increasing block structure is one in which a series of blocks or tiers of water use are identified, with the unit cost of water increasing for each block. Figure 1 is a graphical depiction of an inclining block rate structure. The bulk of the remaining respondents to the 2018 Survey (50 percent) reported a constant block structure, where each unit of water is priced at the same value, while the remaining six percent reported either a declining block or flat rate structure.
What is the “Right” Approach?
Communities periodically review their respective rate structures and often ask: What rate structure is the best fit? What is the right number of tiers? How much water should be included in each tier? What is the most effective pricing interval between the tiers? The answer to these questions, of course, is community-specific and depends upon the community’s water use reduction goals and current customer use patterns. Regardless, the rate structure needs to generate adequate REVENUE to meet system revenue requirements, which will not decrease proportionally with decreased water use.
To get some idea of how communities in the region approach these topics and to specifically explore the use of inclining block rate structures in the region, AE2S Nexus collected water rate tier data as part of the 2018 AE2S Annual Rate Survey effort. Figure 2 illustrates the number of tiers reported by respondents utilizing an inclining block rate structure.

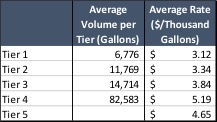
While it is interesting to see how many tiers are utilized by systems with inclining block rates, it is equally interesting to evaluate the structure of those tiers. Table 1 summarizes the average volume within each tier for the reported rate structures, along with the average charge per thousand gallons for each tier. Without individual conversations with each system, it is impossible to represent the intent of those tiers. However, it is common practice to design the tier one volume to be representative of average indoor (domestic) water use or indoor water use plus a small amount of outdoor water use. The data in Table 1 is consistent with that rationale, as the average reported residential winter use for 2018 was 4,240 gallons per month.
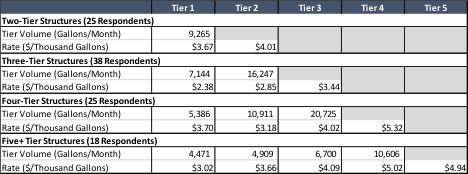
To evaluate tier structure a little further, Table 2 presents the average tier volumes and rates by tier and by overall rate structure – two, three, four, or five-tier inclining block rate configurations.
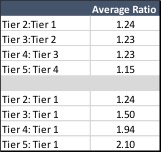
Once a system has considered the appropriate amount of water to include in each tier based on water use patterns and overall water use reduction goals, the next consideration is that of pricing the tiers. An effective inclining block rate structure should have a noticeable increase in price between the blocks. Table 3 summarizes the calculated average relationship between tier structures for respondents to the 2018 AE2S Rate Survey.
When developing both the tier volumes and the associated pricing structure, it is important to equally consider the desired strength of the conservation signal that will be sent, along with the need to generate adequate revenue. For some water systems, many of their costs are fixed and will not significantly reduce in the near-term as water sales decrease.
While inclining block rates can be an effective tool in overall water use reduction initiatives, it is important to consider that high water use does not necessarily indicate wasteful water use. A water-intensive commercial or industrial customer does not necessarily need to have an inclining block rate imposed to signal conservation. Education of these customers along with a constant block structure can be effective.
Finding the “Right” Approach is a Process
As part of overall efforts to reduce water demand requirements, communities throughout the region have implemented inclining block rate structures to encourage efficient water use by sending a price signal to customers. If you are considering revisions to your existing inclining block rate structure or implementing an inclining block for the first time, it is important to anticipate response to price. As customers adjust to the new pricing structure, it is likely that changes will need to be made along the way. Education of rate payers prior to and throughout the process of making rate changes is important to support a smooth transition when making rate changes. Public outreach efforts that address topics such as the value of water, existing or future water supply challenges, cost of operating the utility, the nature of utility costs, goals or approach to managing water demands, and rate-setting basis can be helpful tools. Planning ahead as much as possible is key, as it provides time to both initiate an educational process and ease into any necessary rate changes.