We appreciate all of the voluntary responses we received for the 2018 AE2S Nexus Annual Utility Rate Survey. The Survey booklets are currently being distributed to all participants. We hope the results are useful to systems throughout the region as budgets are finalized and 2019 rates are set, by providing a regional measure of benchmarking themselves against similar systems and/or the system next door.
The Utility Rate Survey booklet contains charts of water, wastewater, and stormwater rates, as well as a Total Utility Bill (water, wastewater, and stormwater). Since each community faces different challenges, it is often useful to look at the combined utility rate when comparing the cost of utility service between communities.
The values reported in the following tables illustrate the monthly residential charge for a bill equating to 6,000 gallons of water and corresponding wastewater usage, as well as a stormwater charge, for systems serving less than 5,000 people. Figures 1 through 7 represent the reported results for communities serving less than 5,000 people in alphabetical order, by State. Figures 8 through 12 illustrate the reported charges for 6,000 gallons of residential water service per month for the regional system respondents, by State.
Figure 1: Reported 2018 Total Utility Bills for 6,000 gallons – Minnesota Respondents Serving Less Than 5,000
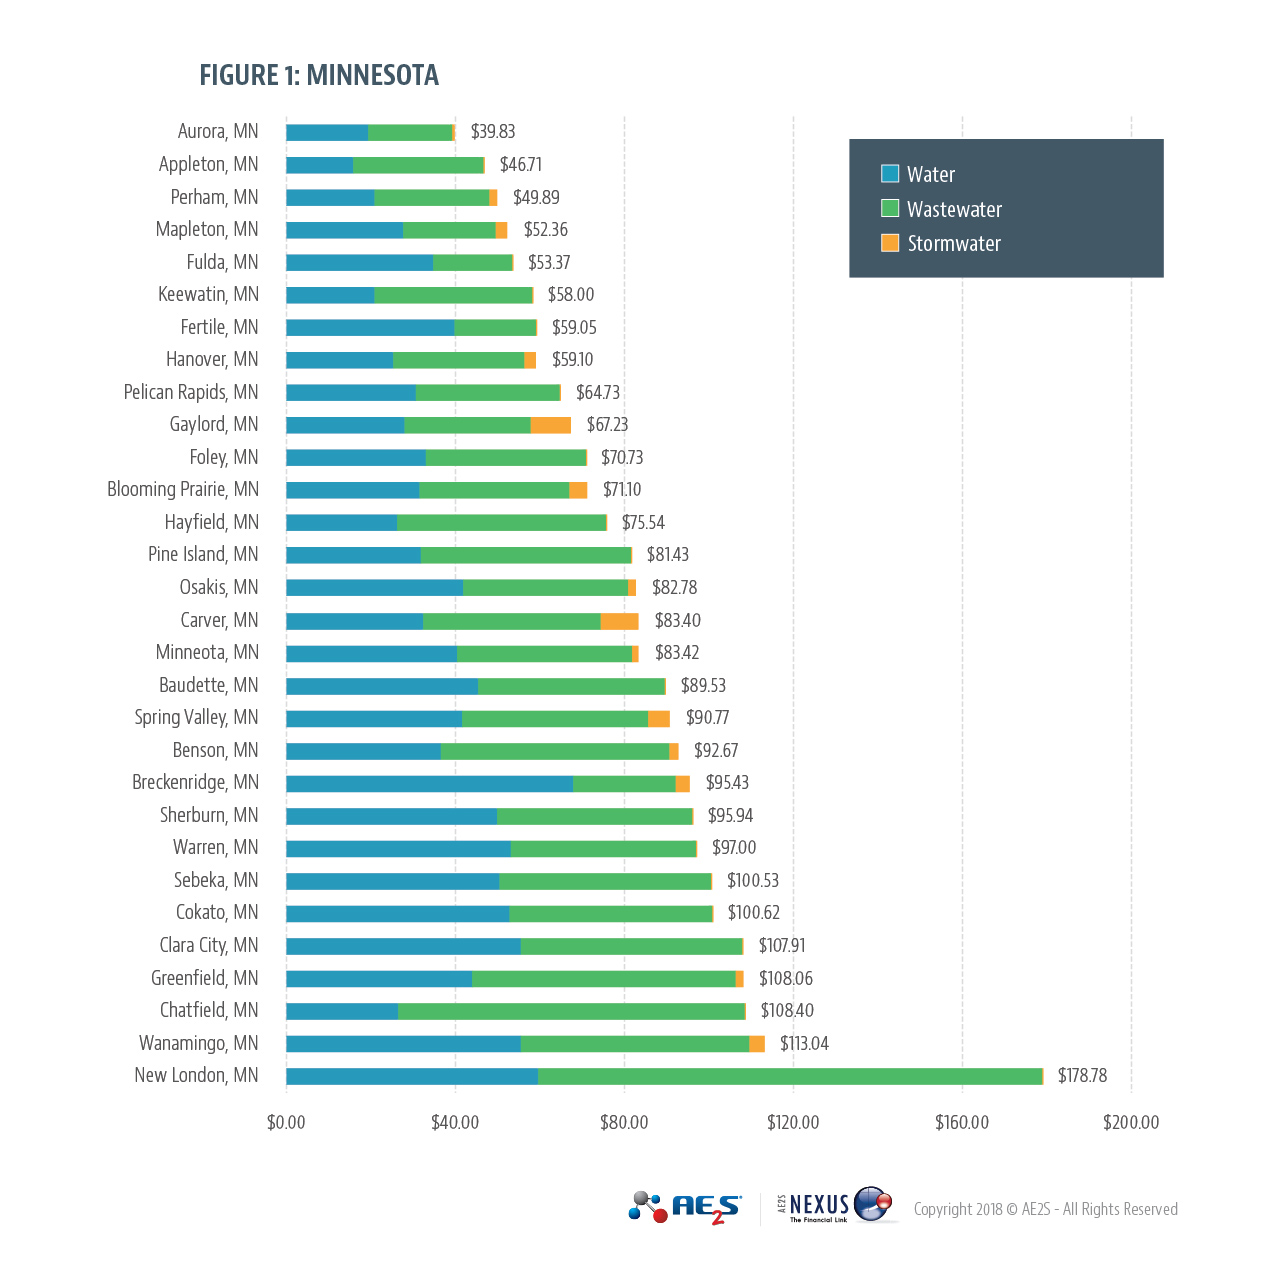
Figure 2: Reported 2018 Utility Bills for 6,000 Gallons – Missouri Respondents Serving Less Than 5,000
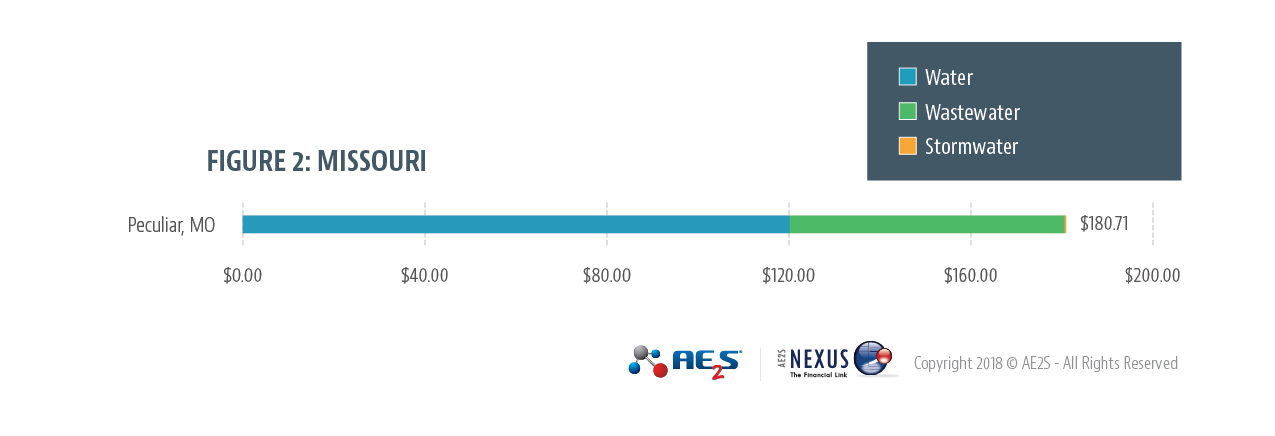
Figure 3: Reported 2018 Total Utility Bill for 6,000 Gallons – Montana Respondents Serving Less Than 5,000
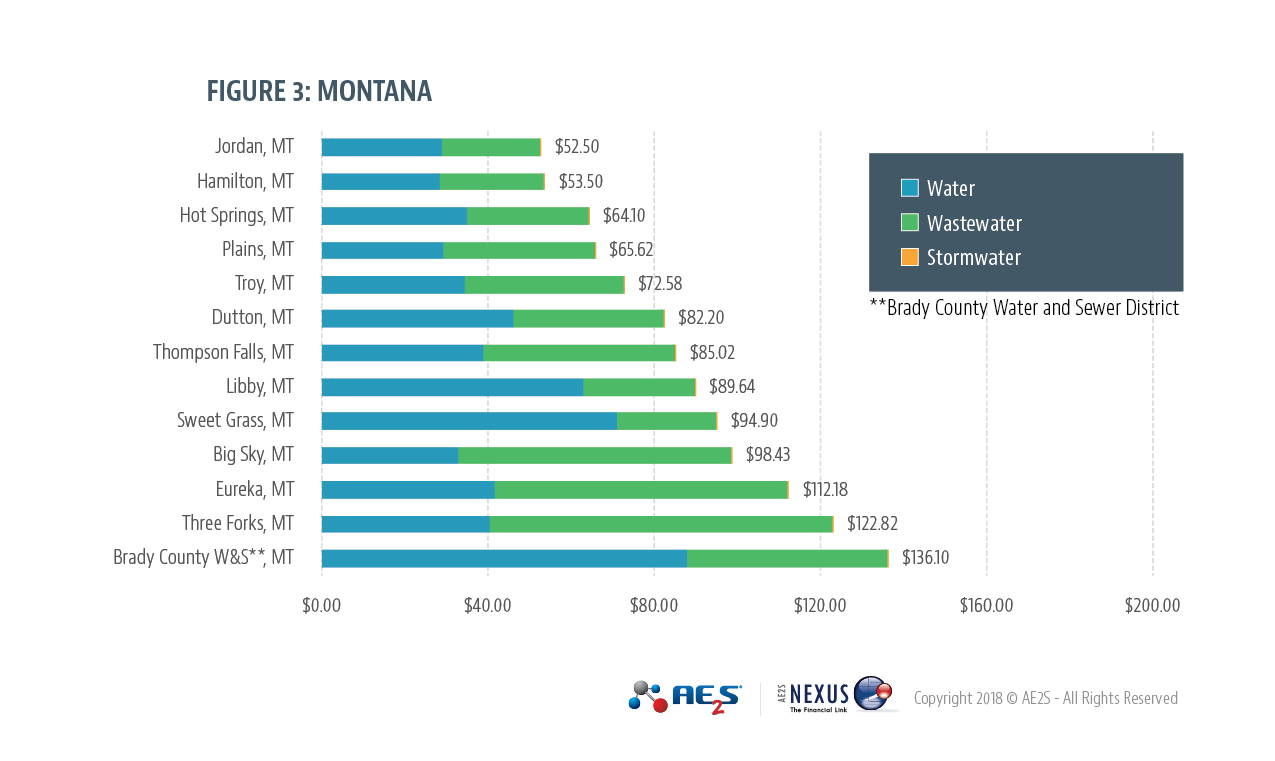
Figure 4: Reported 2018 Total Utility Bill for 6,000 – North Dakota Respondents Serving Less Than 5,000
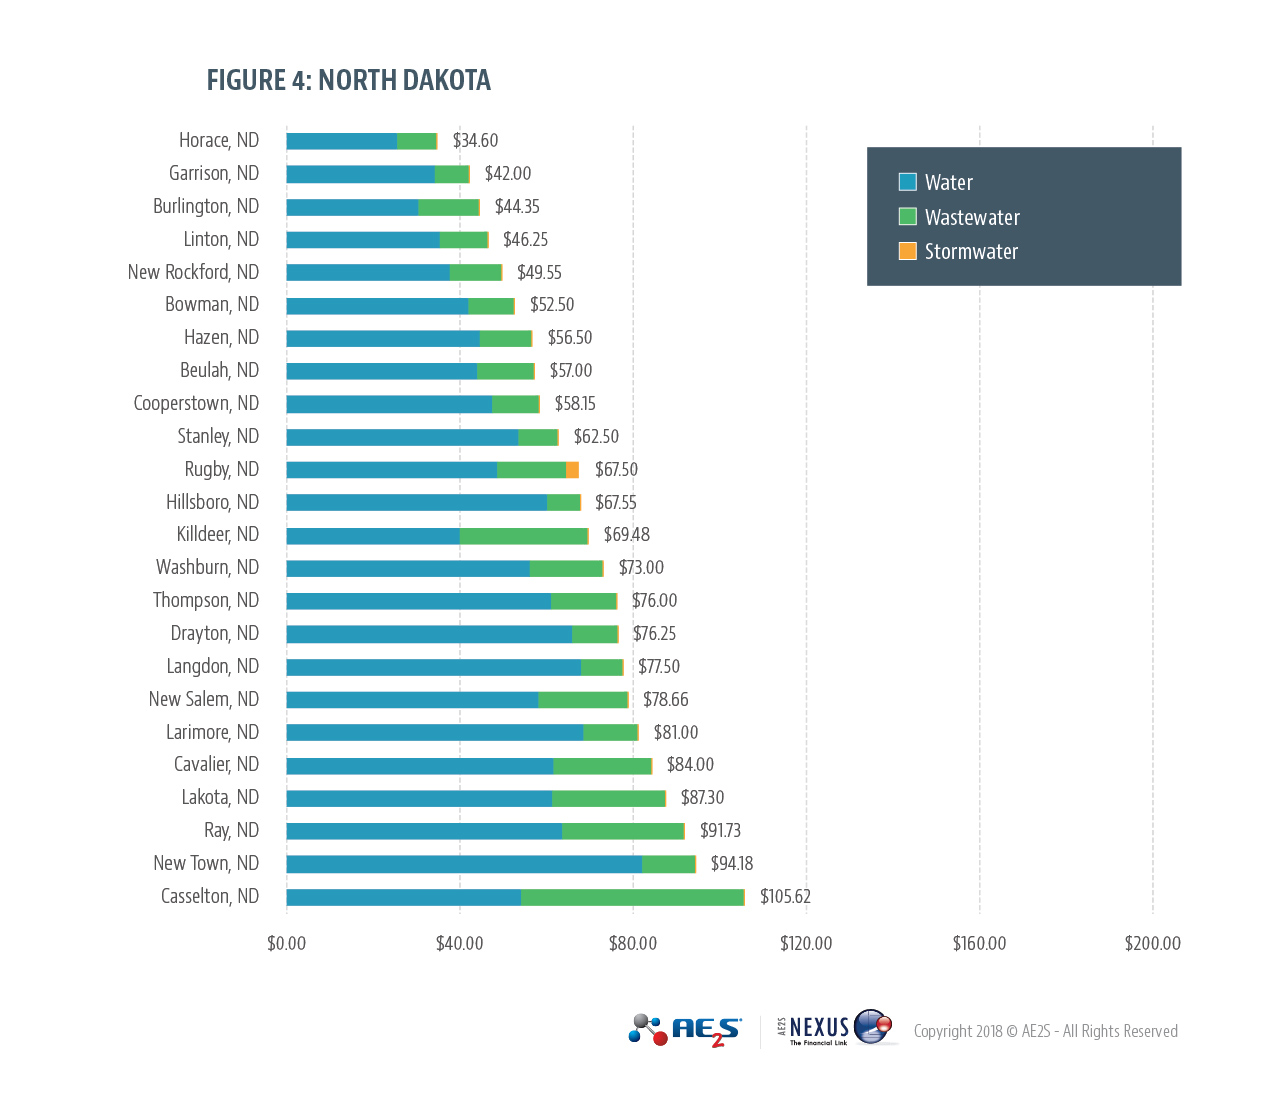
Figure 5: Reported 2018 Total Utility Bill for 6,000 Gallons – South Dakota Respondents Serving Less Than 5,000
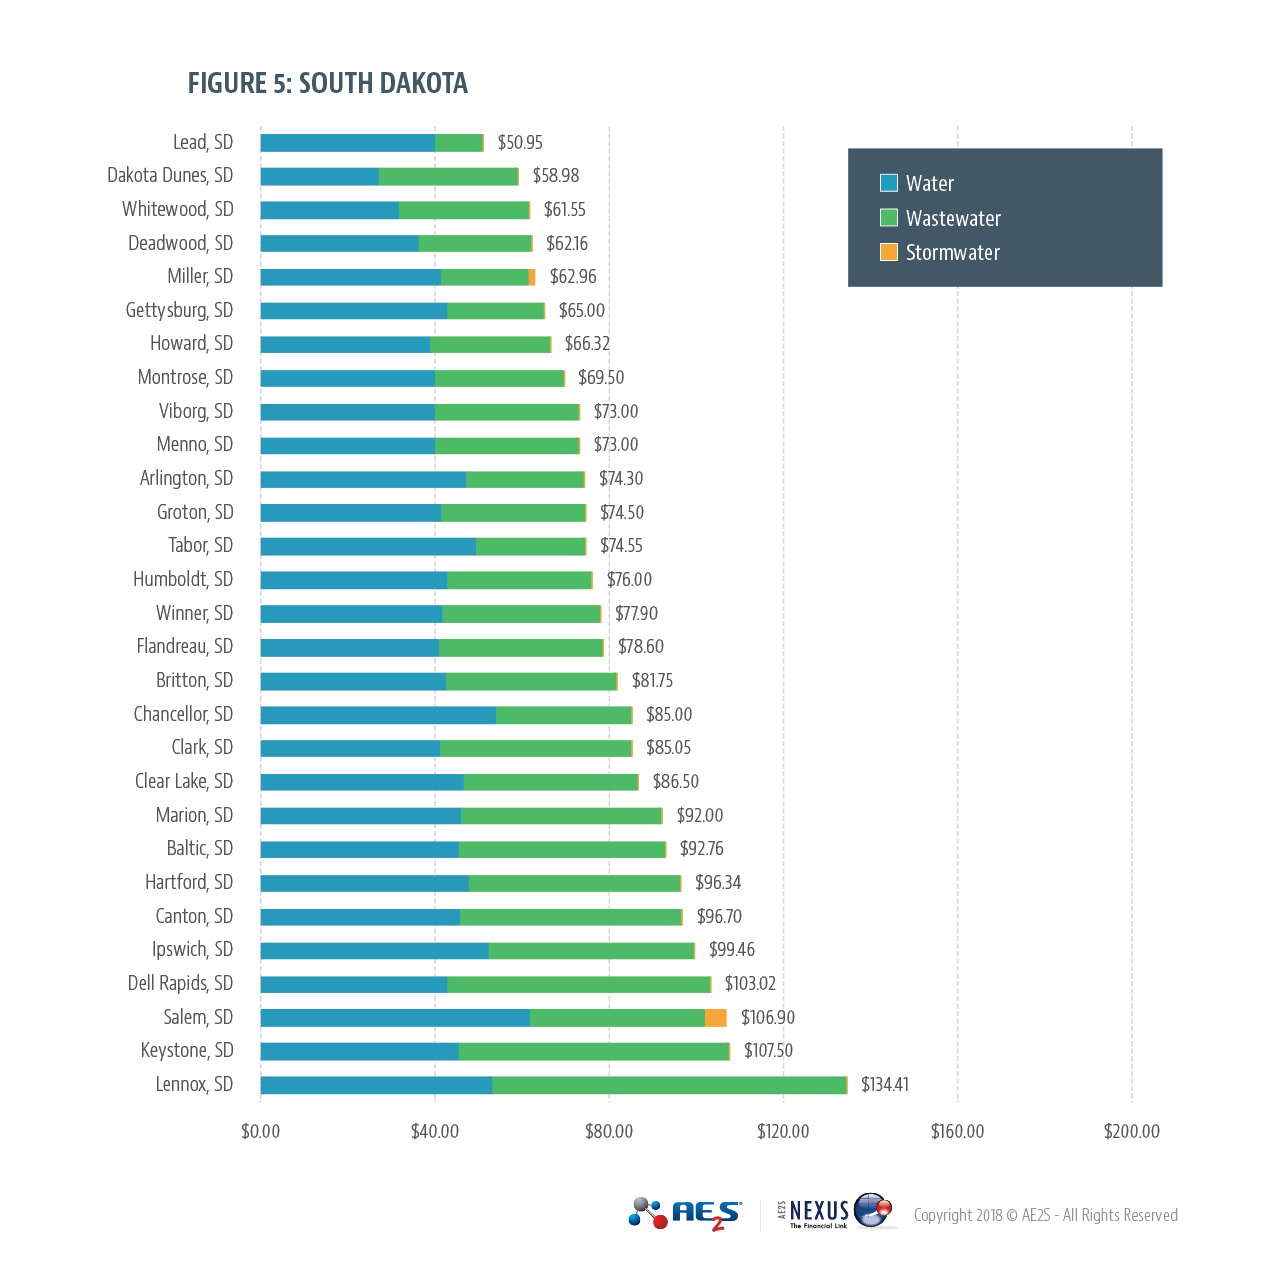 Figure 6: Reported 2018 Total Utility Bill for 6,000 Gallons – Utah Respondents Serving Less Than 5,000
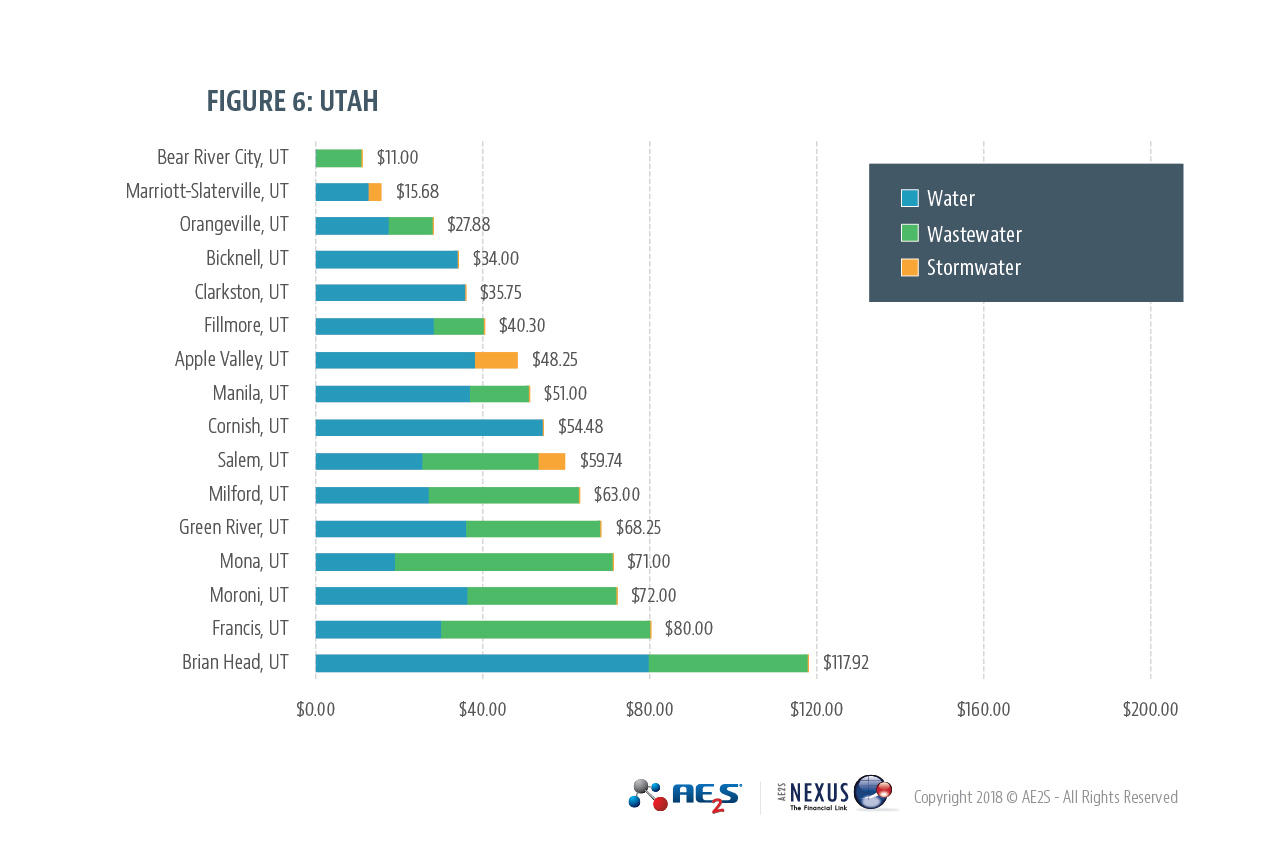
Figure 7: Total Utility Bill for 6,000 Gallons – Wyoming Respondents Serving Less Than 5,000
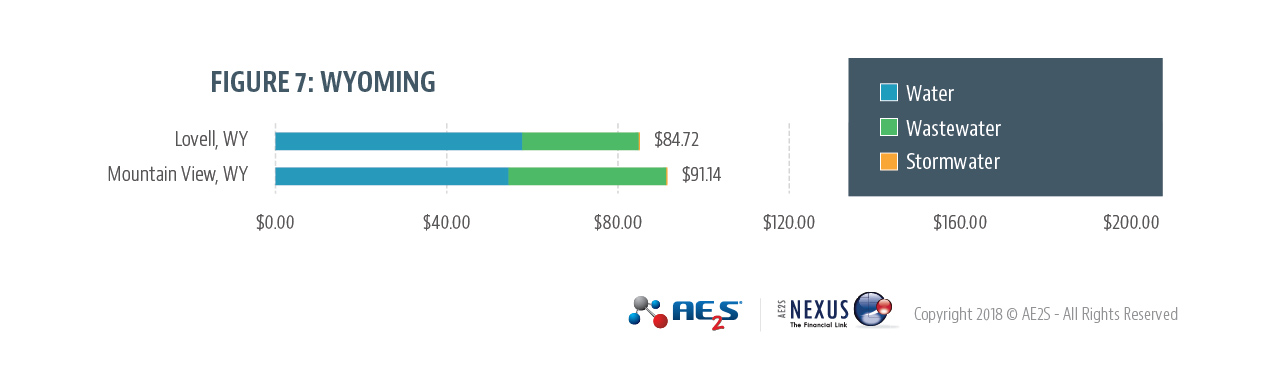
Figure 8: Reported 2018 Regional Water System Charges for 6,000 Gallons – Minnesota
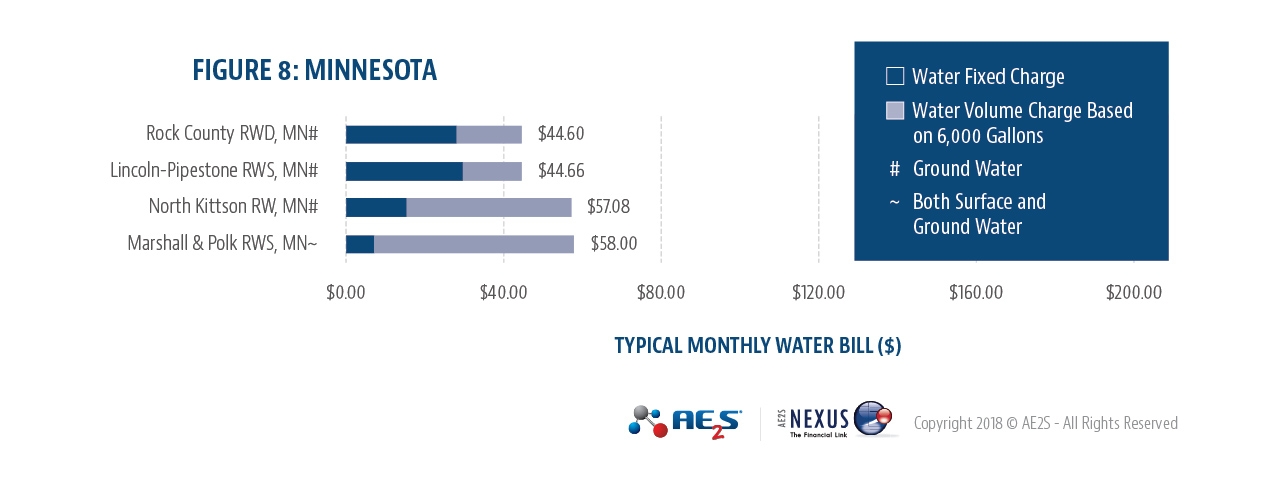
Figure 9: Reported 2018 Regional Water System Charges for 6,000 Gallons – Montana
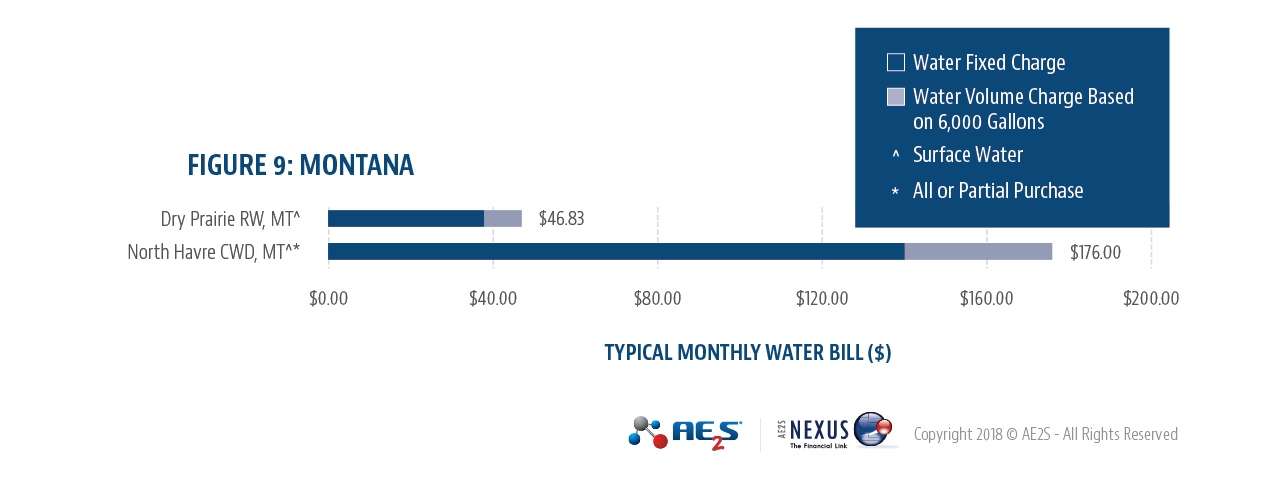
Figure 10: Reported 2018 Regional Water System Charges for 6,000 Gallons – North Dakota
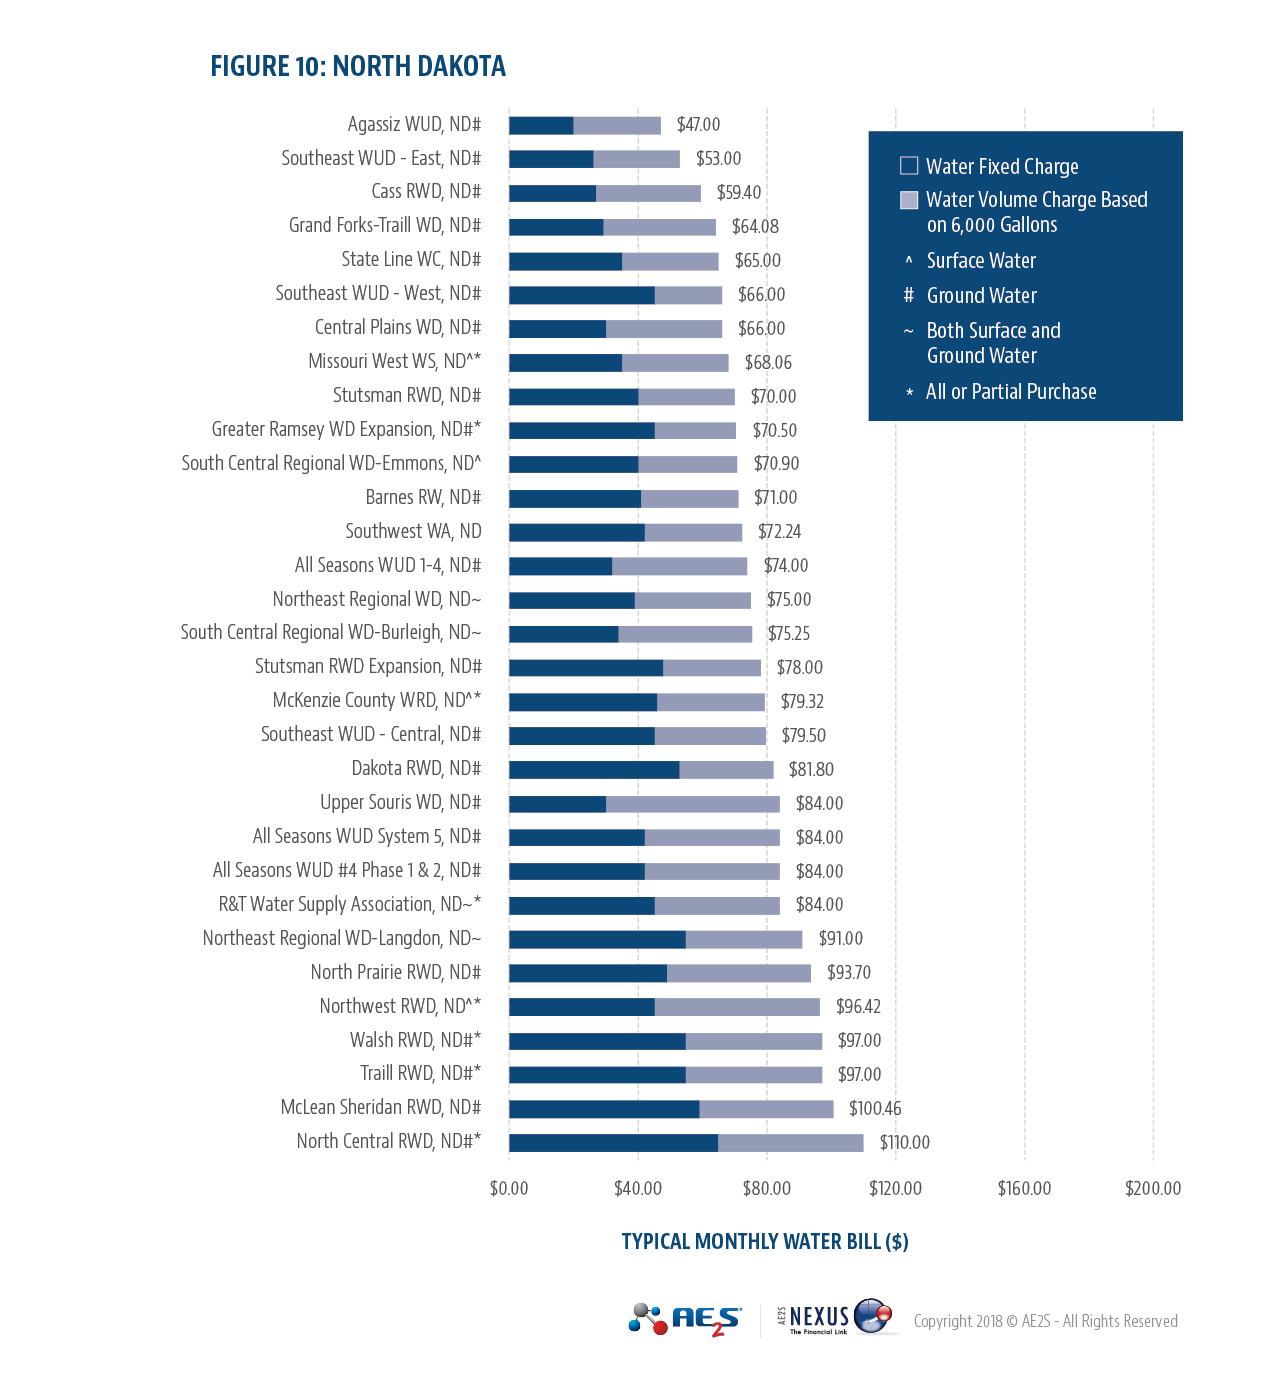
Figure 11: Reported 2018 Regional Water System Charges for 6,000 Gallons – South Dakota
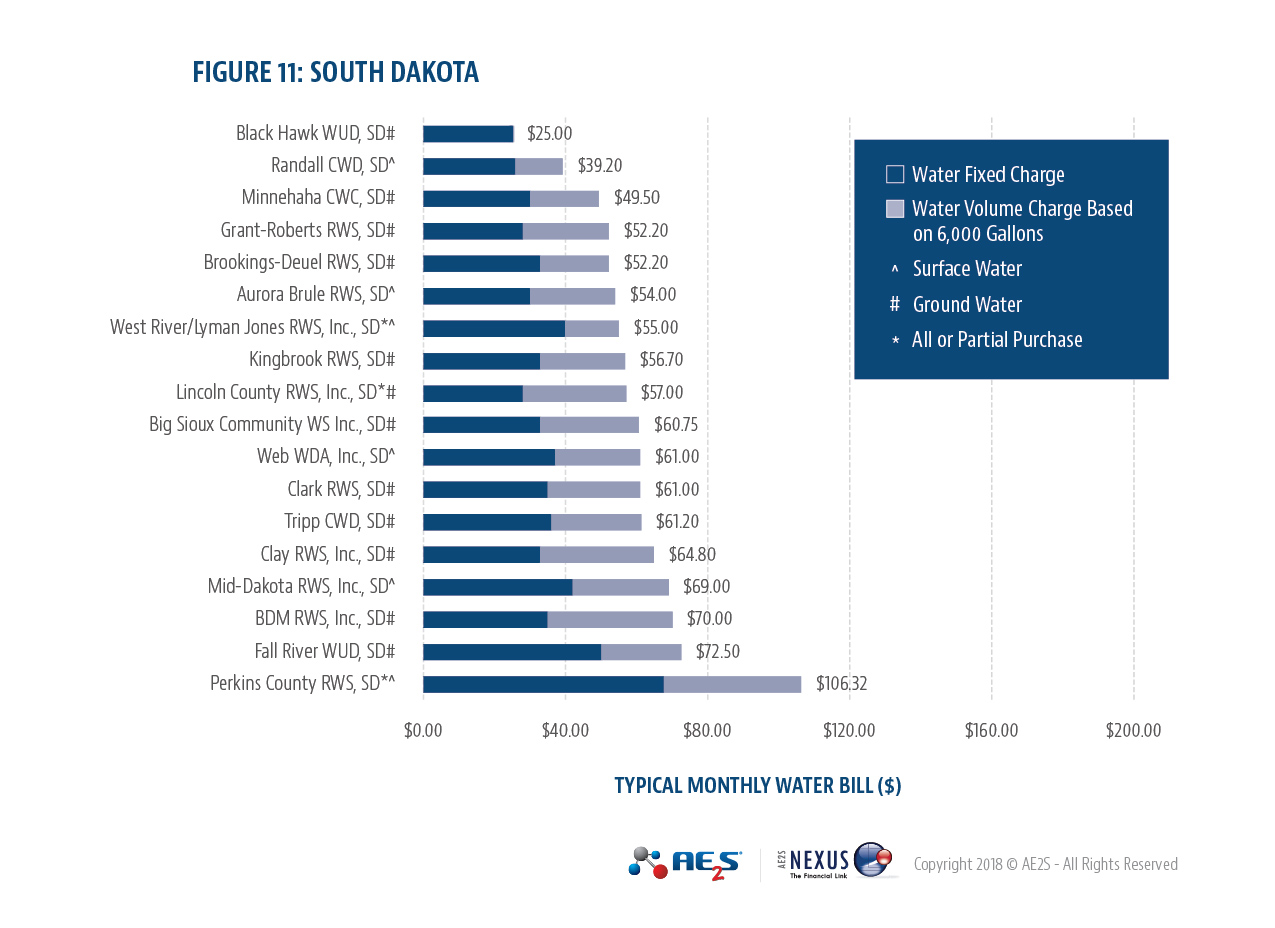
Figure 12: Reported 2018 Regional Water System Charges for 6,000 Gallons – Utah
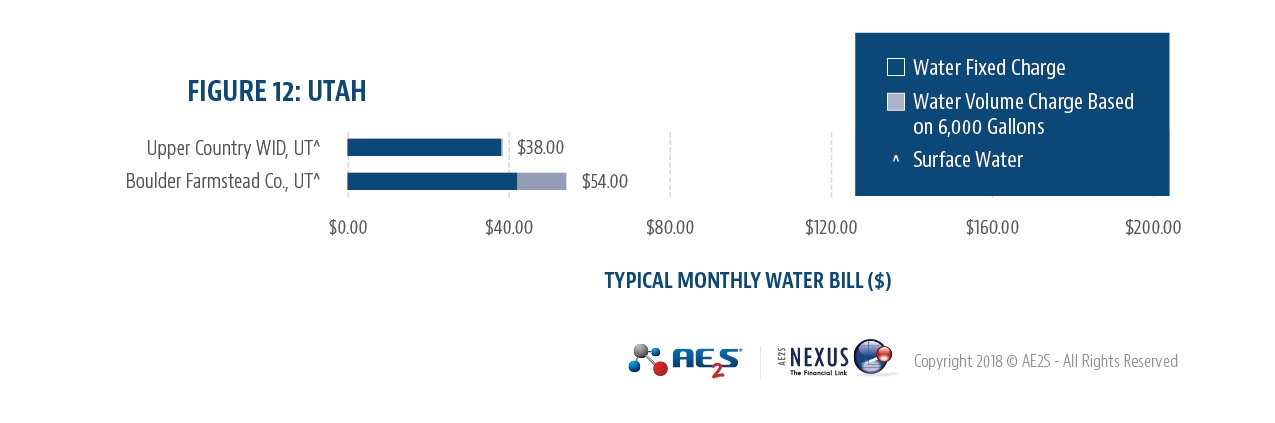
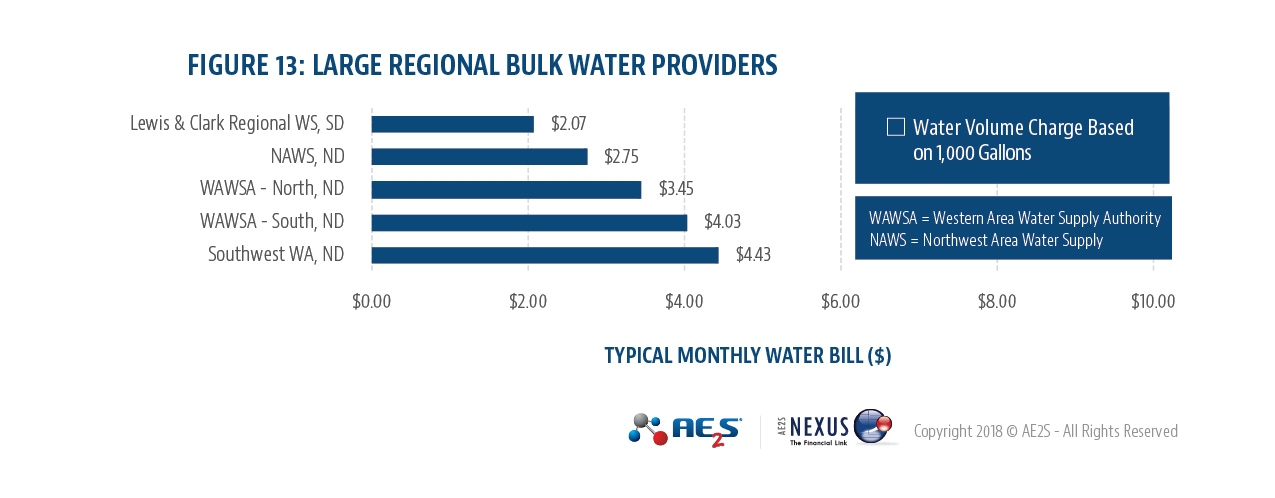
Figure 13 represents the volumetric rate charged by large regional water systems that have been funded in part or in total by either government appropriations or other non-traditional funding approaches. These systems were captured in a separate graphic this year since they are not necessarily comparable to other regional systems because of the unique funding approach.
Figure 13: Reported 2018 Charge per Thousand Gallons – Large Regional Bulk Water Providers
 AE2S Nexus received survey responses from 115 systems serving populations of 5,000 or less and 61 regional water systems. Substantial efforts were taken to report accurate data. Although verification efforts were completed, in some instances data may not have been provided in full or fully verified. We hope you find the survey results useful to your community or regional system as you evaluate your utility rates and plan for the future. If you have any questions related to the 2018 Annual Utility Rate Survey, please contact Miranda Kleven at 701-746-8087 or Miranda.Kleven@AE2S.com.