
AE2S Nexus has begun mailing or hand delivering the 2023 edition of the annual Utility Rate Survey. We would like to thank the 236 participants this year. AE2S Nexus received responses from 121 systems serving populations 5,000 and greater, 64 systems serving populations less than 5,000, and 51 regional rural water systems. Survey data was solicited from utilities in Colorado, Iowa, Minnesota, Montana, Nebraska, North Dakota, South Dakota, Utah, and Wisconsin.
Two survey reports have been prepared: one for systems serving 5,000 people or more, including systems in the Minneapolis/St. Paul metro area; and a second survey for systems that serve fewer than 5,000 people, as well as regional rural water systems. In appreciation for volunteering to provide survey information, each participant receives a hard copy of the complete report.
Reported 2023 Rate Increases
Of the survey respondents serving greater than 5,000 people, 29 are among those in the Minneapolis/St. Paul metro area that receive wastewater services from the Metropolitan Council – Environmental Services. Results from the metro area respondents indicate that 79% of the responding systems implemented an increase to water rates in 2023. For the same group, 75% of wastewater systems and 68% of stormwater systems increased rates in 2023.
Among the 92 respondents from the non-metro systems serving populations greater than 5,000 people, 73% reported water rate increases, and 68% reported wastewater rate increases in 2023, while 45% of stormwater systems increased rates. The average percent increase for each utility by population is shown in Figure 1 for metro and non-metro systems serving 5,000 or more people.
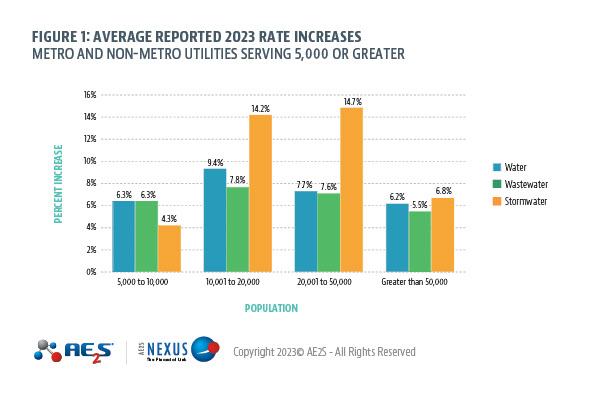
Overall, the average increases in 2023 for water, wastewater, and stormwater systems serving 5,000 people or more were 7.5%, 6.8%, and 10.1%, respectively. For comparison, in 2022 the average rate increases for systems of this size were 5.6% for water, 6.7% for wastewater, and 12.1% for stormwater.
For systems serving fewer than 5,000 people, 57% of respondents reported an increase to water rates, 44% increased wastewater rates, while 6% also reported a stormwater rate increase in 2023. For the small systems that reported increases in 2023, Figure 2 illustrates the average increases by population. Among the systems serving fewer than 5,000 people, the average reported increases for 2023 were 5.7% for water, 12.9% for wastewater, and 11.0% for stormwater. Water, wastewater, and stormwater rate increases reported last year were 7.9%, 10.0% and 6.3%, respectively.
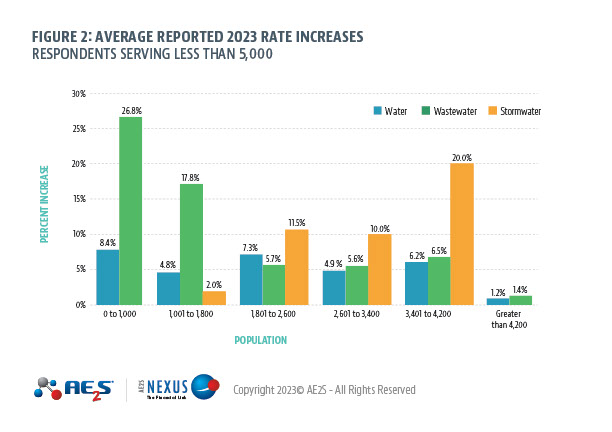
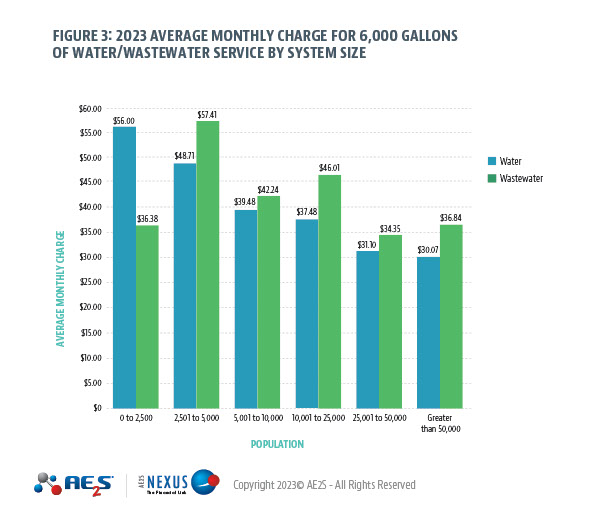
Figure 3 illustrates the 2023 average monthly water and wastewater charges by population grouping for all municipal survey respondents, based on an average monthly use of 6,000 gallons. Of the municipal respondents in 2023, 83% of 2023 respondents also participated in 2022. Overall, the average monthly water and wastewater bill for 6,000 gallons increased by 1.0% from 2022, while the median bill for 6,000 gallons increased by 4.8%.
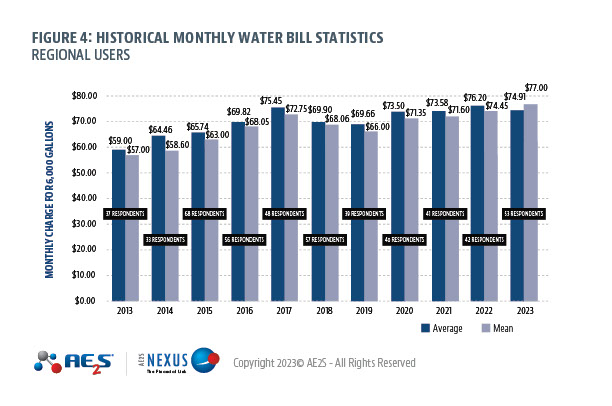
A summary of historical results reported by Regional Rural Water System rate survey participants since 2013 is provided in Figure 4, which shows the average median reported charges for 6,000 gallons of water each year. The number of respondents to the survey each year is also indicated.
Continued Upward Trend in Water & Wastewater Charges
From a historical perspective, the average water and wastewater charge for 6,000 gallons in the region represented by the survey from 2004 to 2022 has climbed at a rate higher than historical inflation values, based on the Consumer Price Index for All Urban Consumers (CPI-U). Figure 5 illustrates the change in average charges for 6,000 gallons of water and wastewater service since 2004* for systems serving greater than 5,000 people (including the Minneapolis/St. Paul metro area).
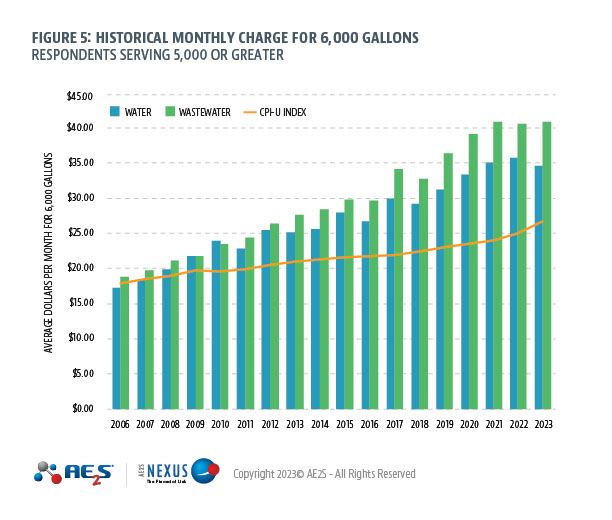
Figure 6 indicates similar information for systems serving less than 5,000 people since 2006*. The results illustrate the challenge that utility managers and policy makers continue to experience in meeting financial demands on system operations, while striving to minimize user charge increases.
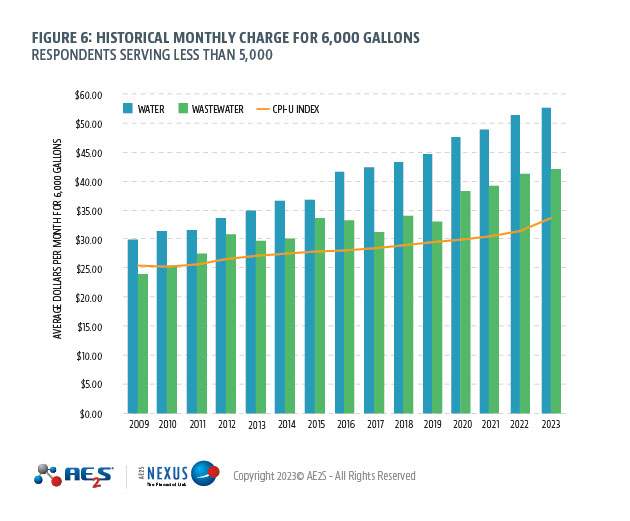
Note: The number of participants and geographical expanse of the annual rate survey has grown substantially since the referenced base years of 2004 and 2006.