It is often noted “the budget is a guide.” That said, when developing a “guide” that is a good faith estimate of actual expected expenditures, experience-based assumptions are critical. Inflation assumptions are one key consideration to ensuring near-term utility budgets or long-term forecasts will meet the actual revenue requirements of the utility. The practice of reviewing current year expenditures and applying an inflationary increase generally serves utilities well. Standard inflationary indices are often based on historical values and are typically set at three percent or less, but it pays to take a look at available data and trends from time to time.
There are a variety of ways to forecast inflation, but after a year that was far from typical, what are the most useful sources for inflation prediction? One tool to explore is The Financial Trend Forecaster website, specifically the Moore Inflation Predictor© (MIP). The MIP is defined as “a highly accurate graphical representation designed to forecast the inflation rate.”
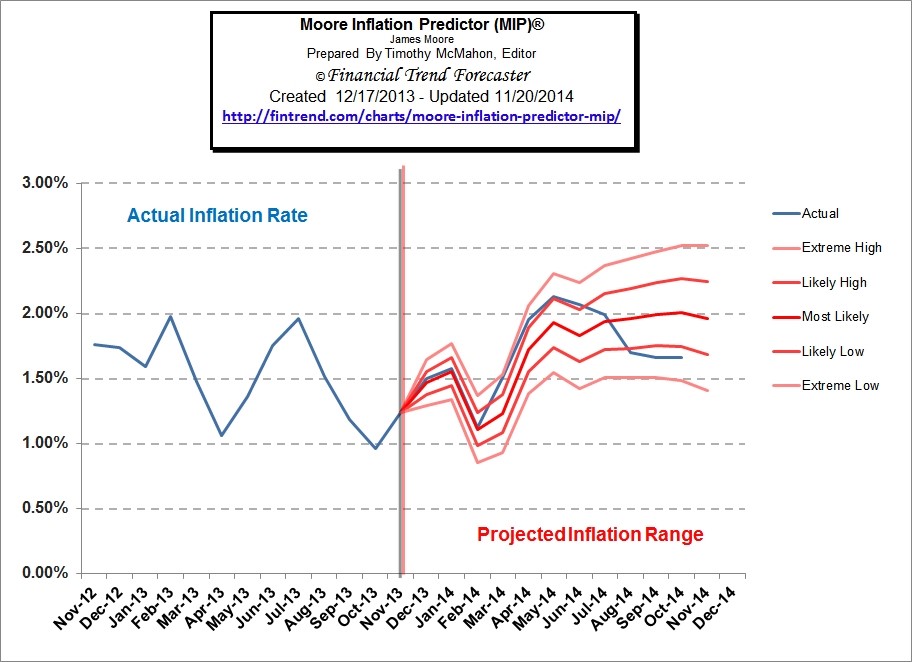
Absent a crystal ball, history can be informative. The Financial Trend Forecaster website recently reviewed how the MIP performed over the past decade, which had several time periods of financial and inflationary uncertainty. Provided below are a couple historical examples of “projections versus reality” from the MIP. The red lines on each chart are scenarios that were predicted at that time, as indicated by the black line through the center of the chart. The actual inflation rate is indicated by the thick blue line, which was added to the projected inflation range later to compare to the projections. Figure 1 was created in December 2011, with the reality line added in September 2012. Figure 2 was created in December 2013, with the reality line added in November 2014. Additional examples can be found on the MIP website.
Figure 1: Moore Inflation Predictor – December 2011
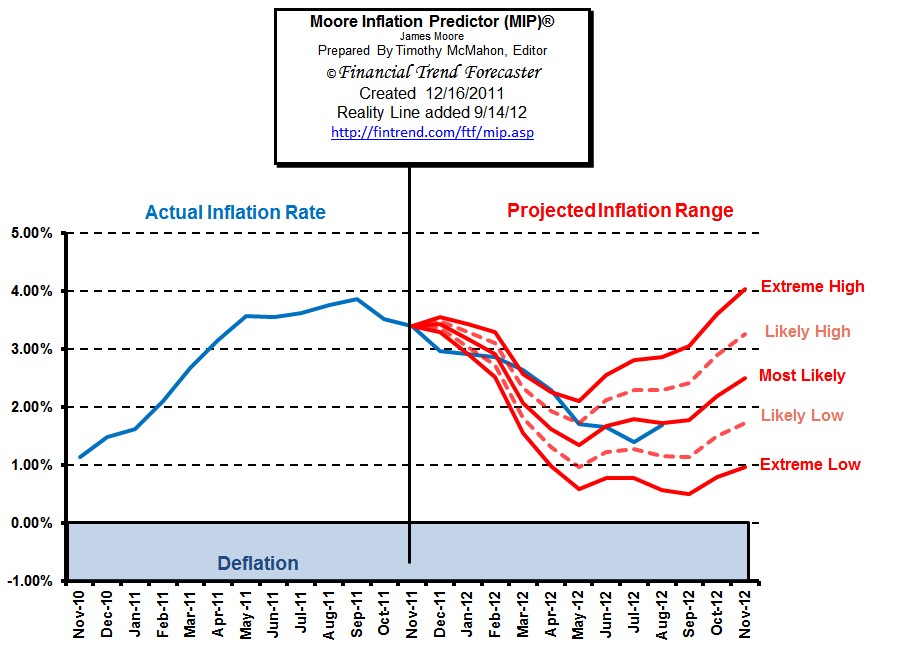
Figure 2: Moore Inflation Predictor – December 2013
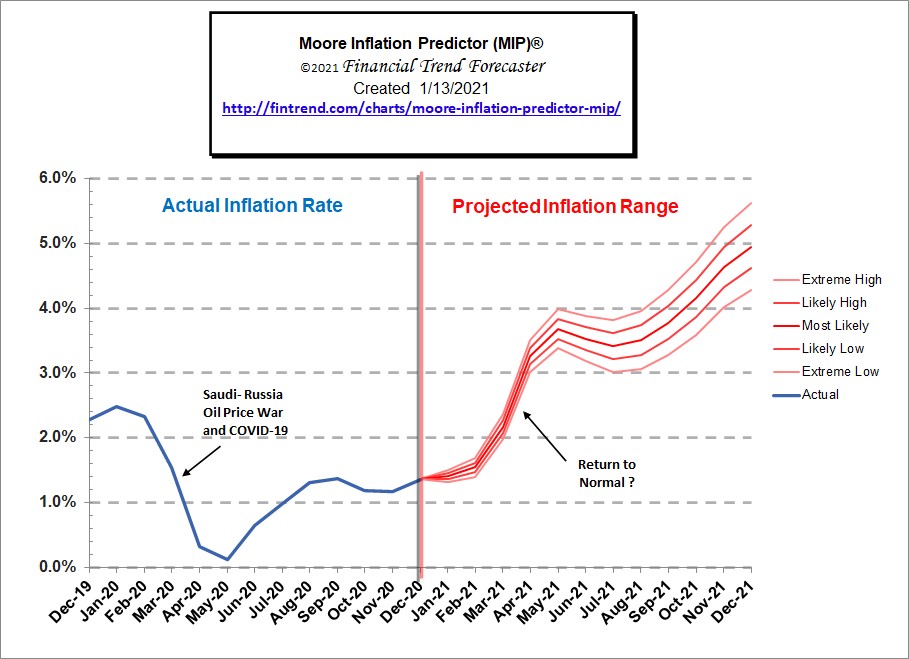
Looking at these two examples, it appears that the MIP did quite well at forecasting inflation. So what does the MIP say today? As shown in Figure 3, the MIP currently forecasts a “return to normal” by summer 2021 with a projected significant increase in inflation by the end of the year. While recently, a factor of 2.5 to 3.0 percent has been a conservative placeholder for inflationary impacts, it looks like a value of 4.0 to 5.0 percent would not be overly cautious for the upcoming year.
Figure 3: Moore Inflation Predictor – January 2021
Inflation impacts all aspects of finance from personal to business and utility management/governance. With a change in leadership in the U.S., it is difficult to know how the economy will react and how that will translate to inflation. Some financial experts expect inflation to stay low, but time will tell. In terms of a reliable forecast tool, the MIP provides one resource available to aid in well-informed budget planning. As always, the best advice is to continue to monitor inflation and make appropriate adjustments to assumptions when necessary.
If you have questions about inflation, feel free to contact Nicole Jacobi, AE2S Nexus Financial Analyst.